Single Candlestick Pattern
After understanding candlestick parts(real body, lower wick, upper wick) and different types of candlestick like Doji, Spinning Top, Marubozu, Hammer, etc, let’s now move a step ahead to see and understand the single candlestick presence on a chart and how to recognize them as bullish or bearish.
Here are the four basic single candlestick-patterns on a Japanese candlestick chart
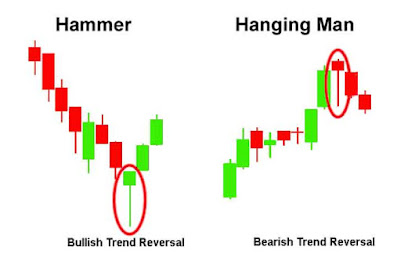
Hammer and Hanging Man
The Hammer and Hanging Man look alike but they have totally different meanings depending on the past price action.
Both have a small real body (red or green), a small or no upper wick, and a long lower wick.
 |
| Hammer and Hanging-Man Candlestick |
 |
| Hammer & Hanging-Man Candle in a Chart |
The Hammer is a bullish reversal pattern that forms during a falling price (downtrend). As the name sounds it hammering out a bottom. When the price is falling and a hammer candlestick forms on a chart, it indicates that the bottom is near and the price may start increasing again.
The long lower wick indicates that bears(sellers) tried to force the price down but bulls(buyers) were able to overcome this selling pressure and managed to close the price near the open.
Just because you see a hammer formation in a downtrend does not mean you should place a buy order quickly. You should wait for more bullish confirmation.
You should watch the next candle movement and if the next candle does not break and sustain below the left side candle (the hammer) and managed to close above the open price of the hammer-candle then this may be a sign of potential trend reversal.
As you know, no signals or indicators can be always 100% true in trading, so we trade on possibilities and past behaviors.
If you have taken a buy position, then your stop-loss should be below the bottom of the left hammer-candle and the target may be three times high of the hammer-candle.
How to recognize a Hammer pattern on a chart?
• Very Small or no upper wick
• The real body should be at the upper end of the trading range.
• The color of the body is not so much important, though a green body is more bullish than a red body.
The Hanging Man
The hanging man formation indicates that sellers are trying to stop bulls from more price increase or they are trying to outnumber buyers.
How to recognize a Hanging Man pattern on a chart?
• Very little or no upper wick
• The real body should be at the upper end of the trading range.
• The color of the body is not so much important, though a red body is more bearish than a green body.
Inverted Hammer and Shooting Star
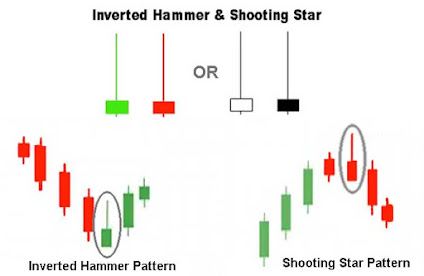
The Inverted Hammer and Shooting Star also look identical. The main differential criteria between them are to see the trend of past price action.
An Inverted Hammer is formed in a downtrend and it is a bullish trend reversal pattern. While a Shooting Star is formed in an uptrend and it is a bearish trend reversal pattern.
Both candlesticks have a small body(red or green), a long upper wick, and a small or absent lower wick.
Shooting Star
A Shooting Star is formed in an uptrend and it is a bearish trend reversal pattern. The Shooting Star opens at its low, go higher above the previous(left) candle but suddenly a gang of Bears comes to drag the price lower. They get success to close the price near the open. This action makes fears among Happy-Bulls and they think it is better to exit in profit. Now the control has come in the hands of the ‘bears gang’ and they are ready to drag the price lower.
 Reviewed by Rajesh Kumar Gupta
on
Thursday, January 14, 2021
Rating:


No comments:
Relevant Comments Only, No Abuses Please